Web Dashboard
CronJob Guardian includes a feature-rich web dashboard for monitoring, analytics, and operations.
Accessing the Dashboard
Port Forward (Development)
kubectl port-forward -n cronjob-guardian svc/cronjob-guardian 8080:8080
Then open http://localhost:8080.
Ingress (Production)
Configure via Helm:
ingress:
  enabled: true
  className: nginx
  hosts:
    - host: guardian.example.com
      paths:
        - path: /
          pathType: Prefix
Dashboard Pages
Overview
The main dashboard showing cluster-wide CronJob health:
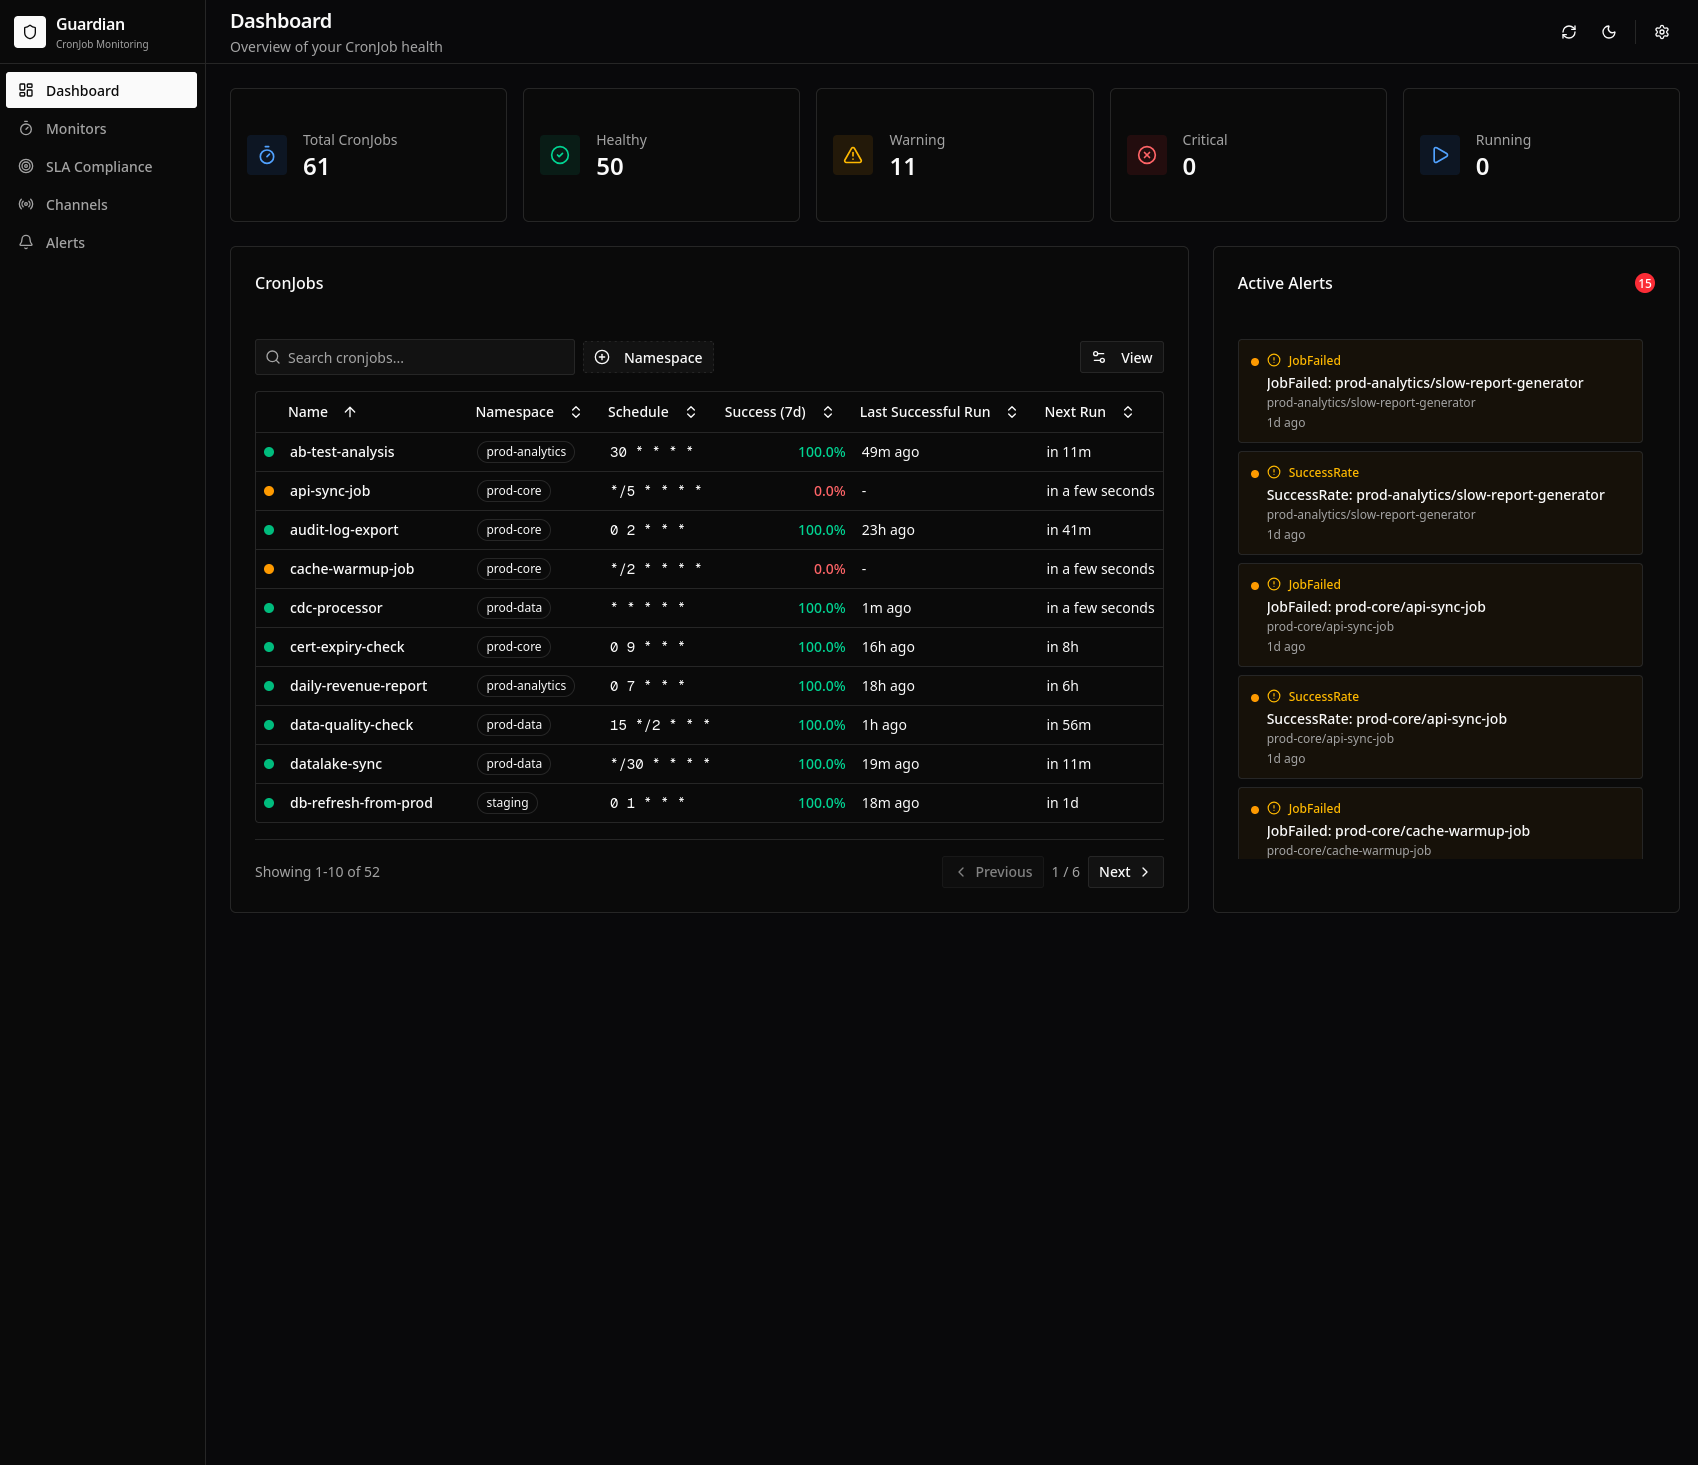
Features:
- Summary cards: Total CronJobs, success rate, active alerts
- CronJob table: All monitored jobs with health status
- Active alerts panel: Current issues requiring attention
- Quick filters: Filter by namespace, status, or search
CronJob Details
Detailed view for individual CronJobs:
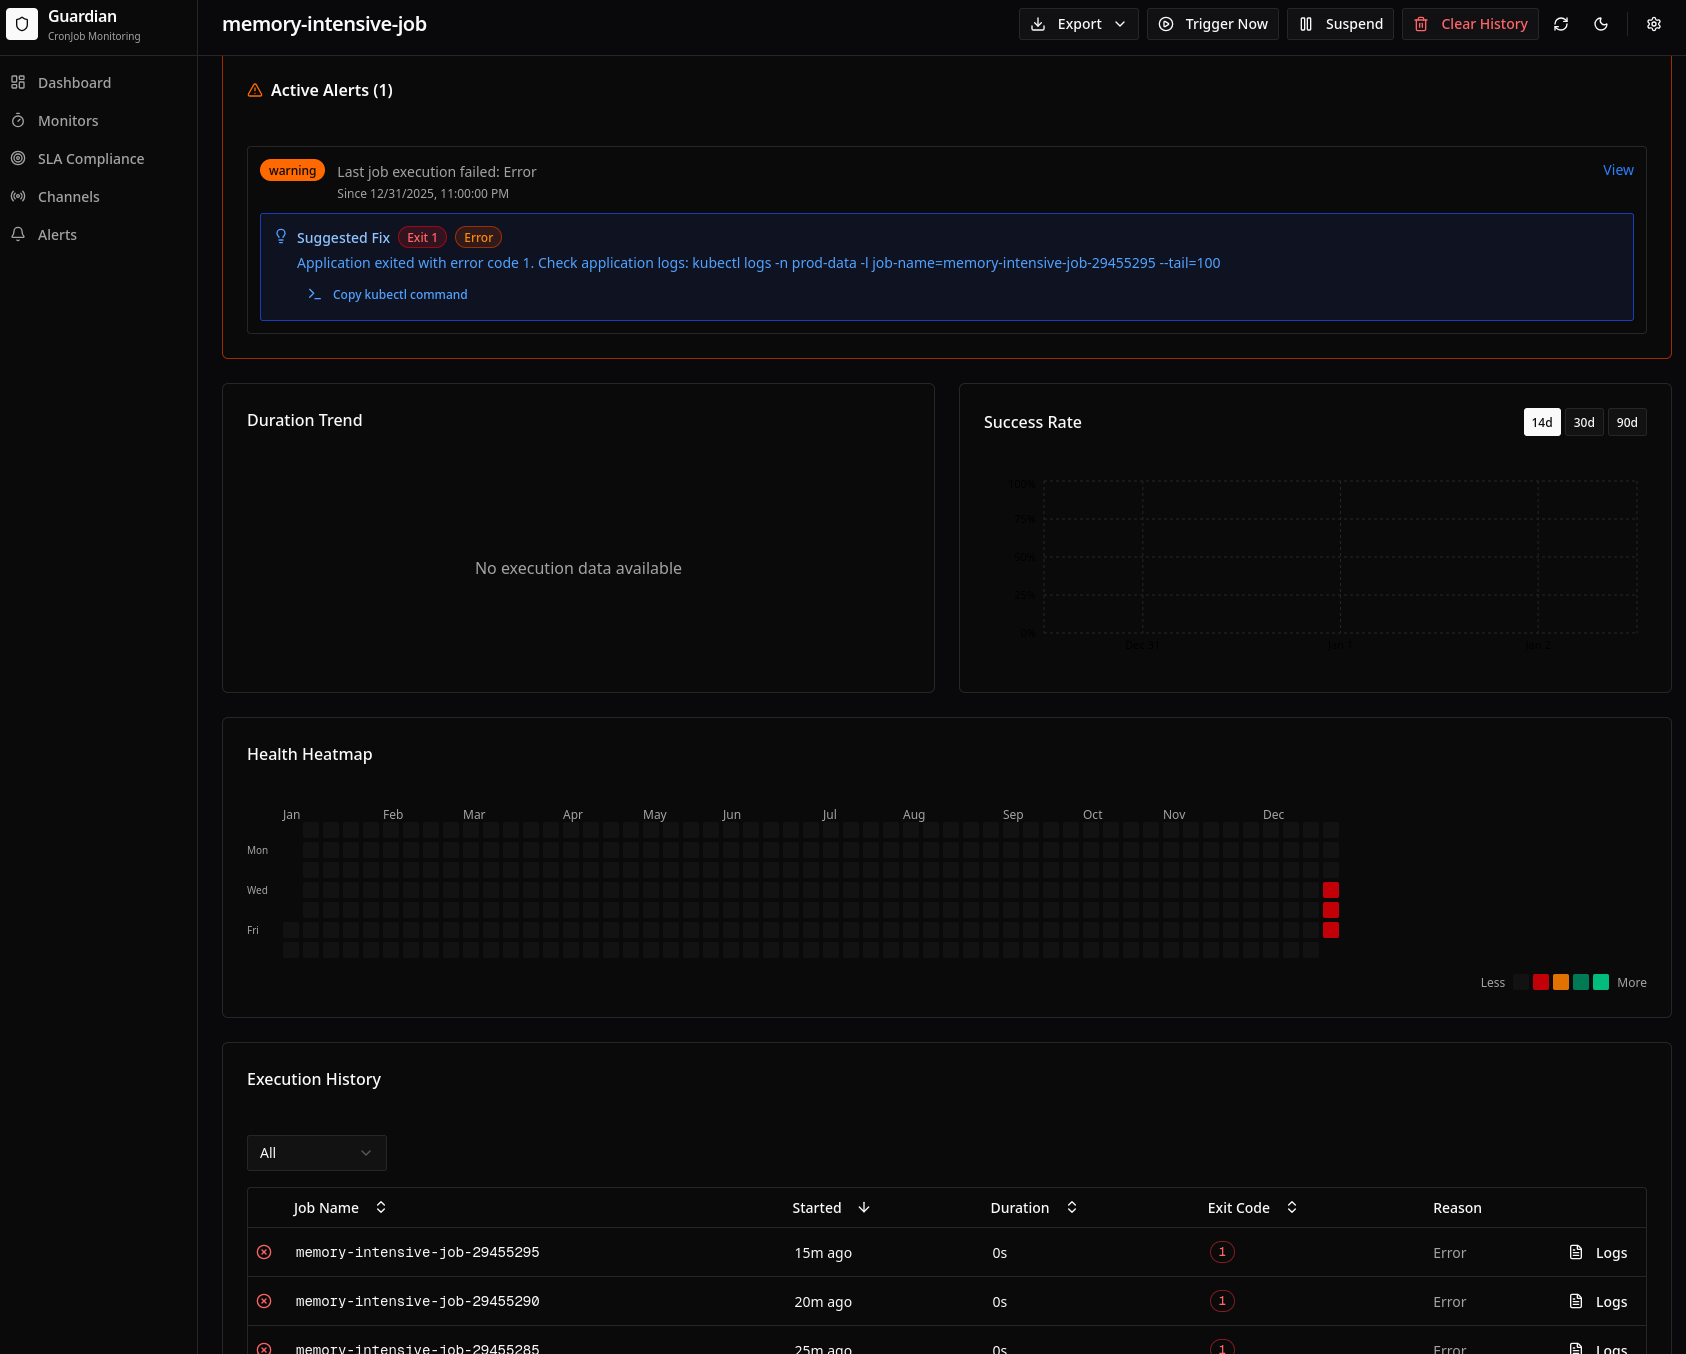
Features:
- Metrics cards: Success rate, avg duration, total executions
- Execution history table: Recent runs with status, duration, timestamps
- Duration trend chart: P50/P95 over time with regression detection
- Success rate chart: Daily success rate with week-over-week comparison
- Health heatmap: GitHub-style calendar showing daily health
Monitors
List of all CronJobMonitor resources:
Features:
- Monitor list: All monitors with summary stats
- CronJob counts: How many jobs each monitor covers
- Aggregate metrics: Combined success rate, duration averages
- Health distribution: Pie chart of healthy/warning/critical jobs
Channels
AlertChannel management:
Features:
- Channel list: All configured channels with type and status
- Test button: Send test alerts to verify configuration
- Status indicators: Connection status, last alert sent
Alerts
Alert history and management:
Features:
- Alert timeline: Chronological list of all alerts
- Filters: By type, severity, time range, CronJob
- Alert details: Full context including logs and events
- Acknowledgment: Mark alerts as acknowledged
SLA
SLA compliance dashboard:
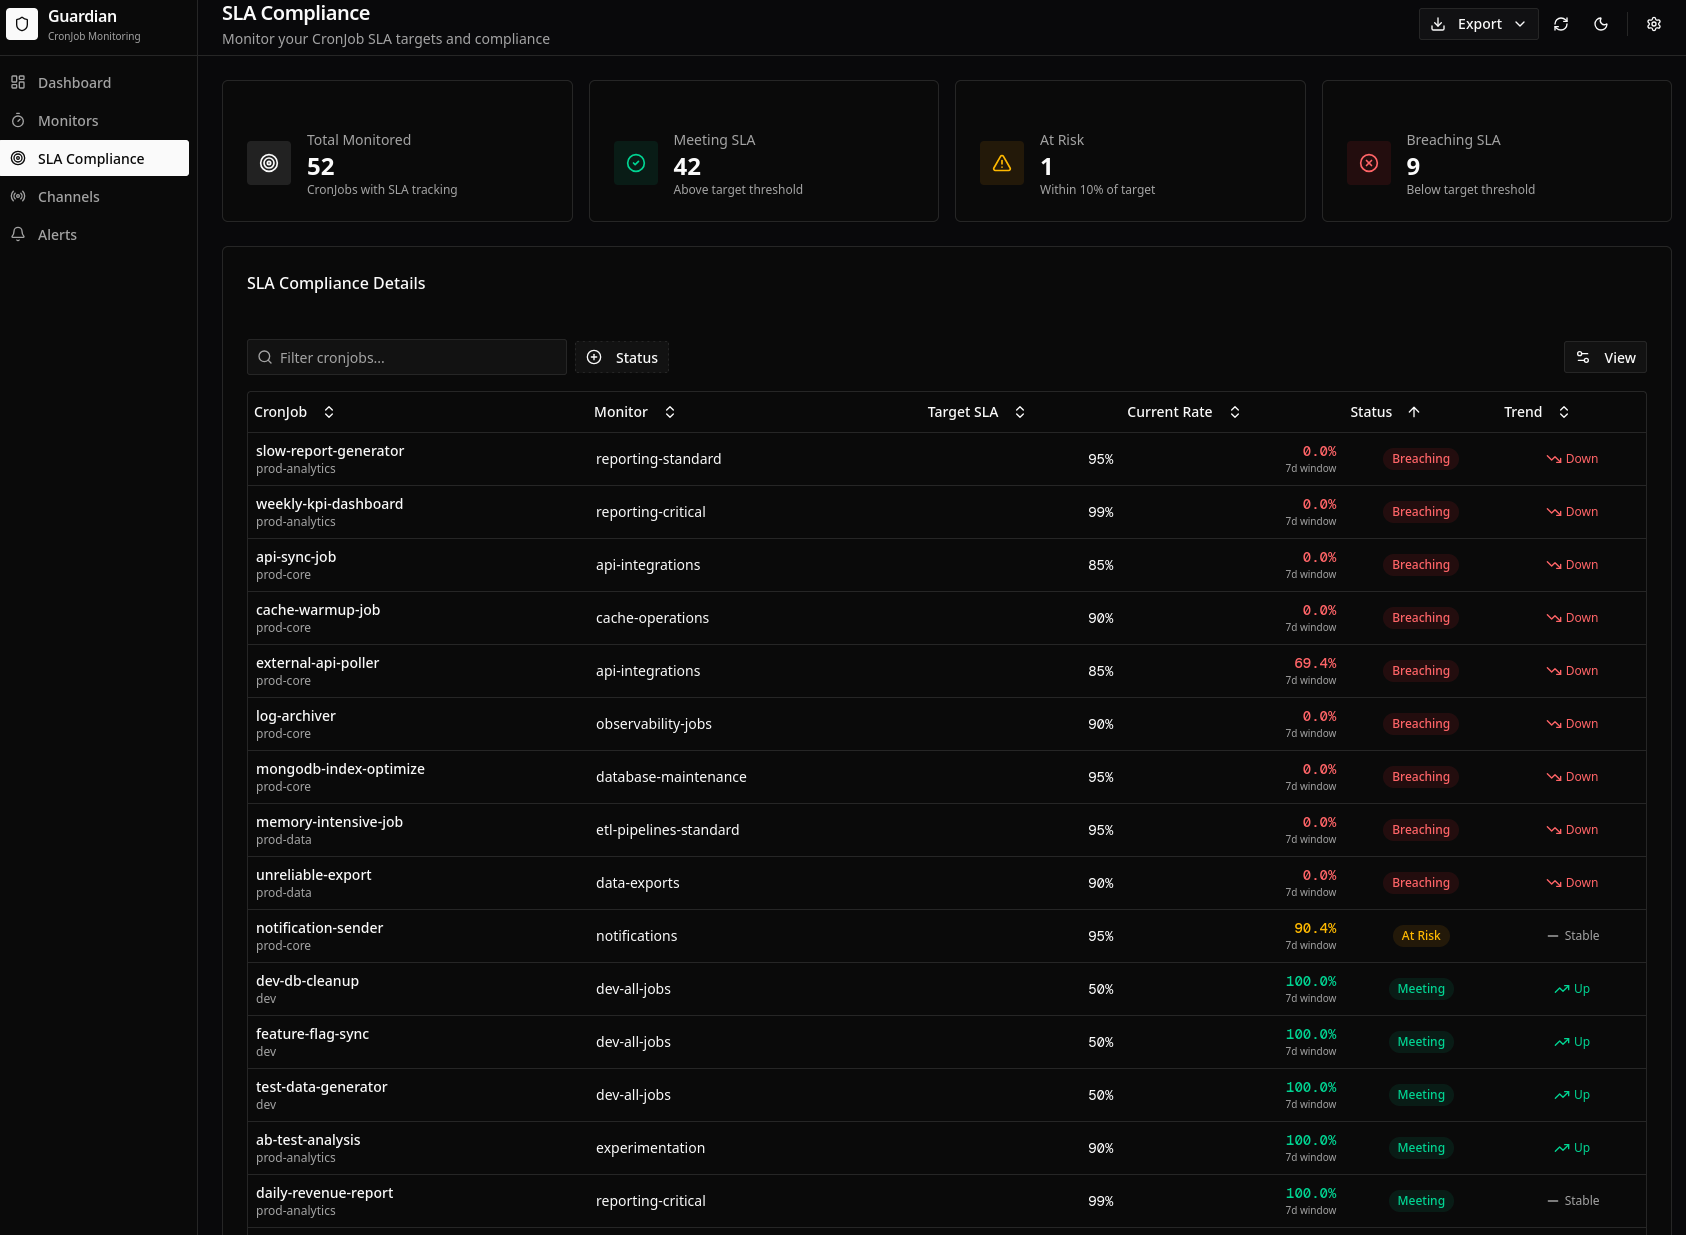
Features:
- Summary cards: Overall SLA compliance percentage
- Compliance table: Per-CronJob SLA status and current rates
- Trend indicators: Arrows showing improvement/degradation
- Breach history: Timeline of SLA violations
Settings
System configuration and utilities:
Features:
- Configuration display: Current operator settings
- Storage statistics: Database size, record counts
- Data pruning: Manual cleanup of old records
- Pattern Tester: Test fix suggestion patterns
Visualization Features
Success Rate Charts
Bar charts with range selection:
- Time ranges: 14, 30, or 90 days
- Comparison: Week-over-week change indicators
- Color coding: Green (healthy), yellow (warning), red (critical)
Duration Trend Charts
Line charts showing performance over time:
- P50 line: Median duration trend
- P95 line: 95th percentile trend
- Regression indicator: Badge when regression detected
- Baseline reference: Horizontal line showing baseline
Health Heatmap
GitHub-style calendar visualization:
- Daily cells: Color coded by success rate
- Tooltip: Hover for exact metrics
- Time ranges: 30, 60, or 90 days
- Pattern detection: Visually identify recurring issues
Monitor Aggregate Charts
Cross-CronJob comparison:
- Bar chart: Success rates by CronJob (sorted)
- Pie chart: Health distribution (healthy/warning/critical)
- Duration comparison: Avg duration by CronJob
Export Features
CSV Export
Download data as CSV:
Executions CSV:
- Execution ID, CronJob, Status, Start Time, Duration, Exit Code
Available for:
- Execution history
- SLA reports
- Alert history
PDF Reports
Generate printable reports:
- Summary metrics: Key statistics
- Charts: Rendered visualizations
- Alert history: Recent issues
- Branding: Customizable header
Dark Mode
The dashboard supports system preference dark mode:
- Automatically matches OS/browser setting
- Manual toggle available
- All charts optimized for dark backgrounds
REST API
The dashboard is backed by a REST API:
# Get all CronJobs
curl http://localhost:8080/api/v1/cronjobs

# Get executions
curl http://localhost:8080/api/v1/cronjobs/production/daily-backup/executions

# Trigger a job
curl -X POST http://localhost:8080/api/v1/cronjobs/production/daily-backup/trigger
See REST API Reference for complete documentation.
Best Practices
- Use filters effectively: Narrow down to relevant jobs quickly
- Check heatmaps regularly: Visual patterns reveal recurring issues
- Monitor duration trends: Catch regressions before they cause failures
- Review SLA dashboard weekly: Track compliance over time
- Test channels periodically: Ensure alerts will work when needed
Related
- REST API Reference - Programmatic access
- Prometheus Metrics - External monitoring integration
- High Availability - Production deployment