SLA Tracking & Compliance
CronJob Guardian tracks success rates over rolling time windows and alerts when they drop below your defined thresholds.
Overview
SLA tracking monitors:
- Success rate percentage over a configurable rolling window
- Duration thresholds for jobs running too long
- Rolling window calculations that update automatically
Configuration
Basic SLA Monitoring
spec:
  sla:
    minSuccessRate: 95        # Alert if success rate drops below 95%
    windowDays: 7             # Calculate over last 7 days
With Duration Thresholds
spec:
  sla:
    minSuccessRate: 99
    windowDays: 30
    maxDuration: 1h           # Alert if any execution exceeds 1 hour
Full Configuration
spec:
  sla:
    minSuccessRate: 99.9
    windowDays: 30
    maxDuration: 30m
    durationRegressionThreshold: 50    # Alert if P95 increases by 50%
    durationBaselineWindowDays: 14     # Compare against last 14 days
Examples
Critical Production Jobs
critical-sla.yaml
apiVersion: guardian.illenium.net/v1alpha1
kind: CronJobMonitor
metadata:
  name: critical-jobs
  namespace: production
spec:
  selector:
    matchLabels:
      tier: critical

  sla:
    minSuccessRate: 99.9      # 99.9% success rate required
    windowDays: 30            # Over 30 days
    maxDuration: 15m          # Must complete within 15 minutes

  alerting:
    channelRefs:
      - name: pagerduty-critical
    severityOverrides:
      slaBreached: critical
Standard Business Jobs
standard-sla.yaml
apiVersion: guardian.illenium.net/v1alpha1
kind: CronJobMonitor
metadata:
  name: business-reports
  namespace: analytics
spec:
  selector:
    matchLabels:
      type: report

  sla:
    minSuccessRate: 95        # 95% success rate
    windowDays: 7             # Over 7 days
    maxDuration: 2h           # Allow up to 2 hours

  alerting:
    channelRefs:
      - name: team-slack
Data Pipeline SLA
pipeline-sla.yaml
apiVersion: guardian.illenium.net/v1alpha1
kind: CronJobMonitor
metadata:
  name: etl-pipeline
  namespace: data
spec:
  selector:
    matchLabels:
      pipeline: etl

  sla:
    minSuccessRate: 98
    windowDays: 14
    maxDuration: 45m
    durationRegressionThreshold: 30    # Alert on 30% slowdown
    durationBaselineWindowDays: 7

  alerting:
    channelRefs:
      - name: data-team-slack
      - name: ops-pagerduty
Dashboard View
The SLA dashboard provides:
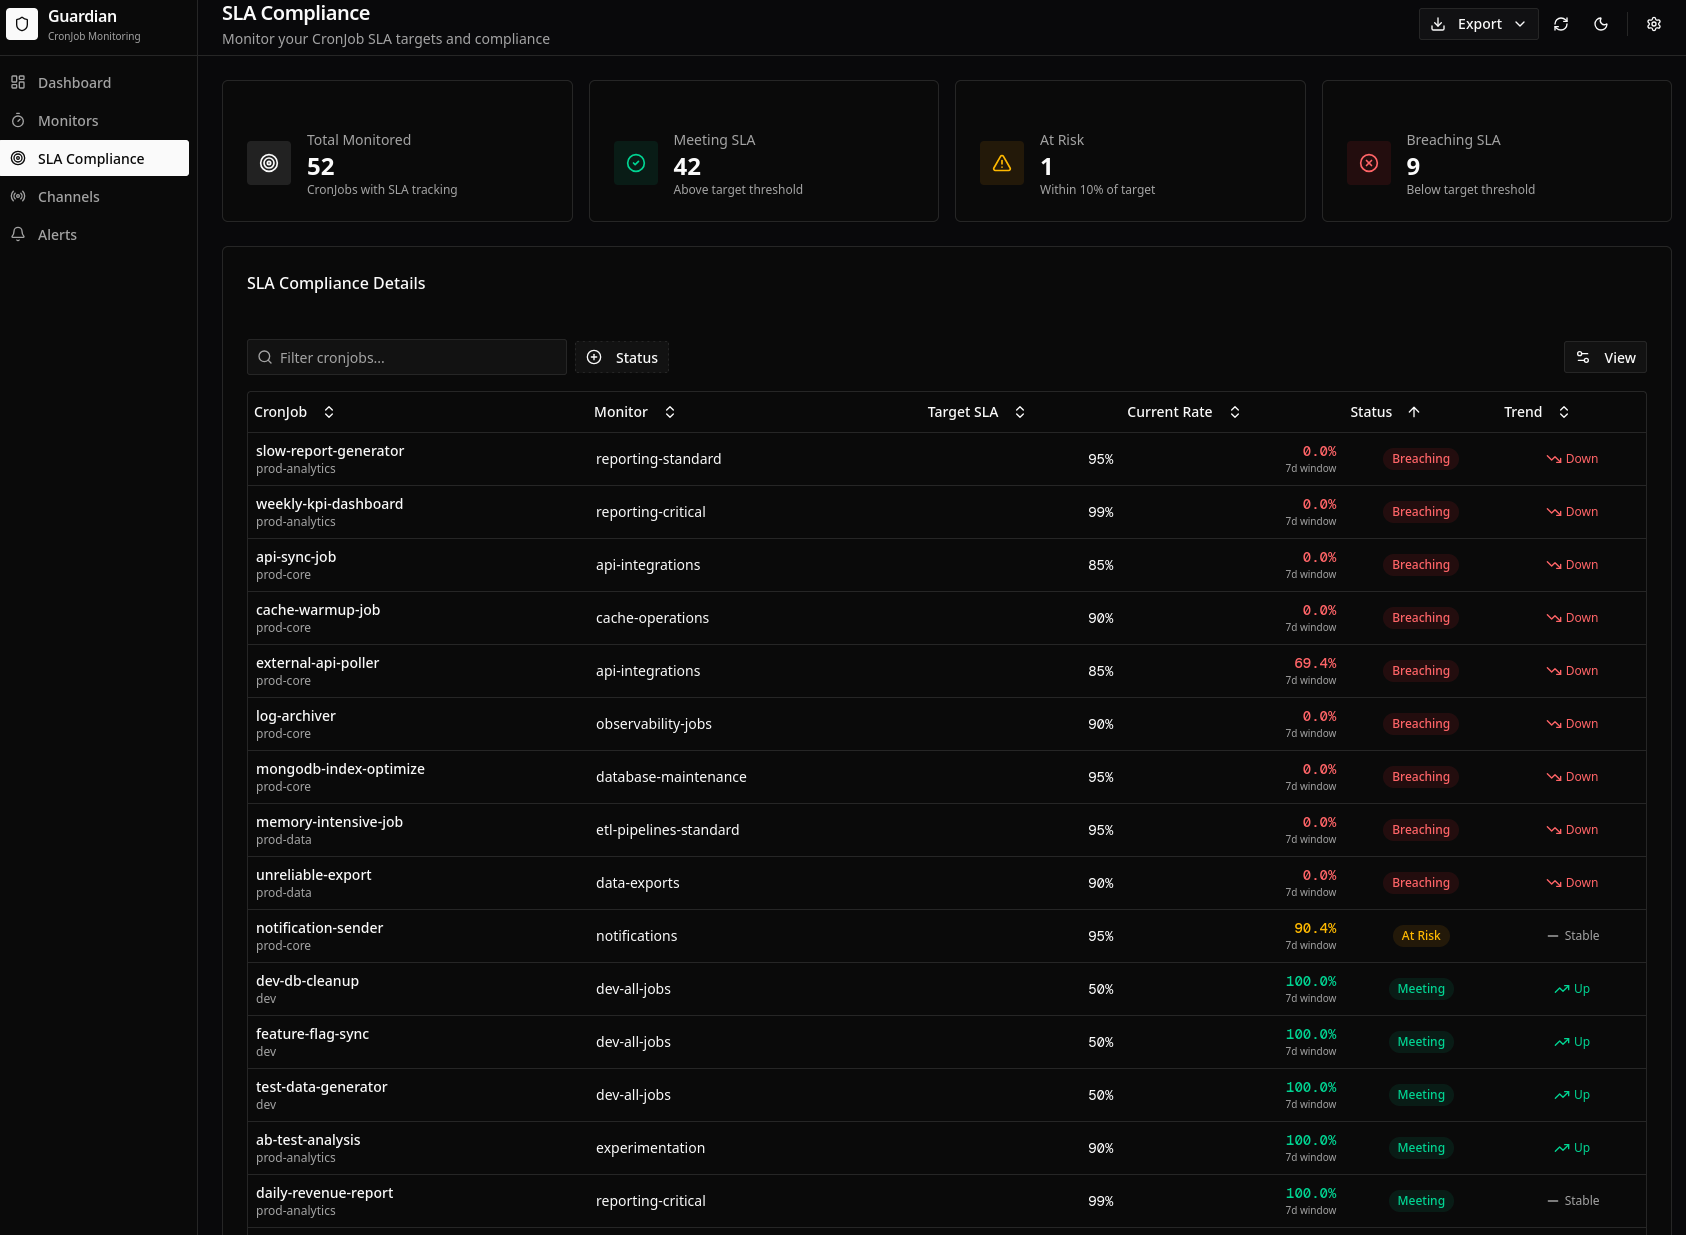
- Summary cards: Overall SLA compliance across all monitored CronJobs
- Compliance table: Per-CronJob SLA status with current rates
- Trend indicators: Arrows showing improvement or degradation
- Breach history: Timeline of SLA violations
Configuration Reference
| Field | Type | Description | Default |
|---|---|---|---|
minSuccessRate | float | Minimum success rate percentage (0-100) | - |
windowDays | int | Rolling window size in days | 7 |
maxDuration | duration | Maximum allowed execution duration | - |
durationRegressionThreshold | int | Percentage increase in P95 to trigger alert | - |
durationBaselineWindowDays | int | Days to use for baseline calculation | 7 |
How It Works
Success Rate Calculation
success_rate = (successful_executions / total_executions) * 100
Calculated over the configured windowDays rolling window.
Duration Tracking
- P50 (median): Half of executions are faster
- P95: 95% of executions are faster
- P99: 99% of executions are faster
These are updated after each execution completes.
SLA Recalculation
A background scheduler periodically recalculates SLA metrics:
- Queries executions within the window
- Calculates success rate
- Calculates duration percentiles
- Updates CronJobMonitor status
- Triggers alerts if thresholds are violated
Alert Types
SLA Violation Alert
Triggered when success rate drops below minSuccessRate:
🚨 SLA Violation: daily-backup

Success Rate: 92.3% (threshold: 95%)
Window: 7 days
Failures: 5 of 65 executions

Recent failures:
- 2024-01-15 02:00 - OOMKilled
- 2024-01-14 02:00 - BackoffLimitExceeded
...
Duration Threshold Alert
Triggered when execution exceeds maxDuration:
⏱️ Duration Threshold Exceeded: etl-sync

Duration: 1h 23m (threshold: 1h)
Started: 2024-01-15 03:00
Completed: 2024-01-15 04:23

This is 38% over the configured limit.
Best Practices
- Set realistic thresholds: Base on historical performance, not aspirational goals
- Use appropriate windows: Longer windows smooth out noise; shorter catch issues faster
- Layer thresholds: Different SLAs for critical vs. standard jobs
- Monitor duration trends: Catch performance regressions before they cause failures
- Review regularly: Adjust thresholds as job behavior evolves
Related
- Duration Regression - Performance trend detection
- Dead-Man's Switch - Catch missing runs
- Dashboard - Visualize SLA compliance