Duration Regression Detection
CronJob Guardian tracks execution duration over time and alerts when jobs show significant performance degradation.
Why It Matters
Jobs can gradually slow down due to:
- Growing data volumes
- Database bloat
- Resource contention
- Inefficient code changes
- Infrastructure degradation
Without regression detection, jobs might eventually timeout or impact dependent systems before anyone notices.
Configuration
Basic Regression Detection
spec:
  sla:
    durationRegressionThreshold: 50    # Alert on 50% increase in P95
    durationBaselineWindowDays: 14     # Compare against last 14 days baseline
With Absolute Limits
spec:
  sla:
    maxDuration: 30m                   # Hard limit
    durationRegressionThreshold: 30    # Alert on 30% increase
    durationBaselineWindowDays: 7
How It Works
- Baseline Calculation: Calculates P95 duration over the baseline window
- Current Measurement: Measures recent P95 duration
- Comparison: Computes percentage change
- Alert Trigger: Alerts if increase exceeds threshold
regression_percent = ((current_p95 - baseline_p95) / baseline_p95) * 100

if regression_percent > threshold:
    trigger_alert()
Examples
ETL Pipeline Monitoring
etl-regression.yaml
apiVersion: guardian.illenium.net/v1alpha1
kind: CronJobMonitor
metadata:
  name: etl-jobs
  namespace: data
spec:
  selector:
    matchLabels:
      type: etl

  sla:
    minSuccessRate: 98
    windowDays: 7
    maxDuration: 2h
    durationRegressionThreshold: 25    # Alert on 25% slowdown
    durationBaselineWindowDays: 14

  alerting:
    channelRefs:
      - name: data-engineering-slack
Report Generation
report-regression.yaml
apiVersion: guardian.illenium.net/v1alpha1
kind: CronJobMonitor
metadata:
  name: reports
  namespace: analytics
spec:
  selector:
    matchLabels:
      app: reporter

  sla:
    durationRegressionThreshold: 50
    durationBaselineWindowDays: 30     # Long baseline for weekly jobs

  alerting:
    channelRefs:
      - name: analytics-slack
Dashboard Visualization
The duration trend chart shows P50 and P95 over time with regression indicators:
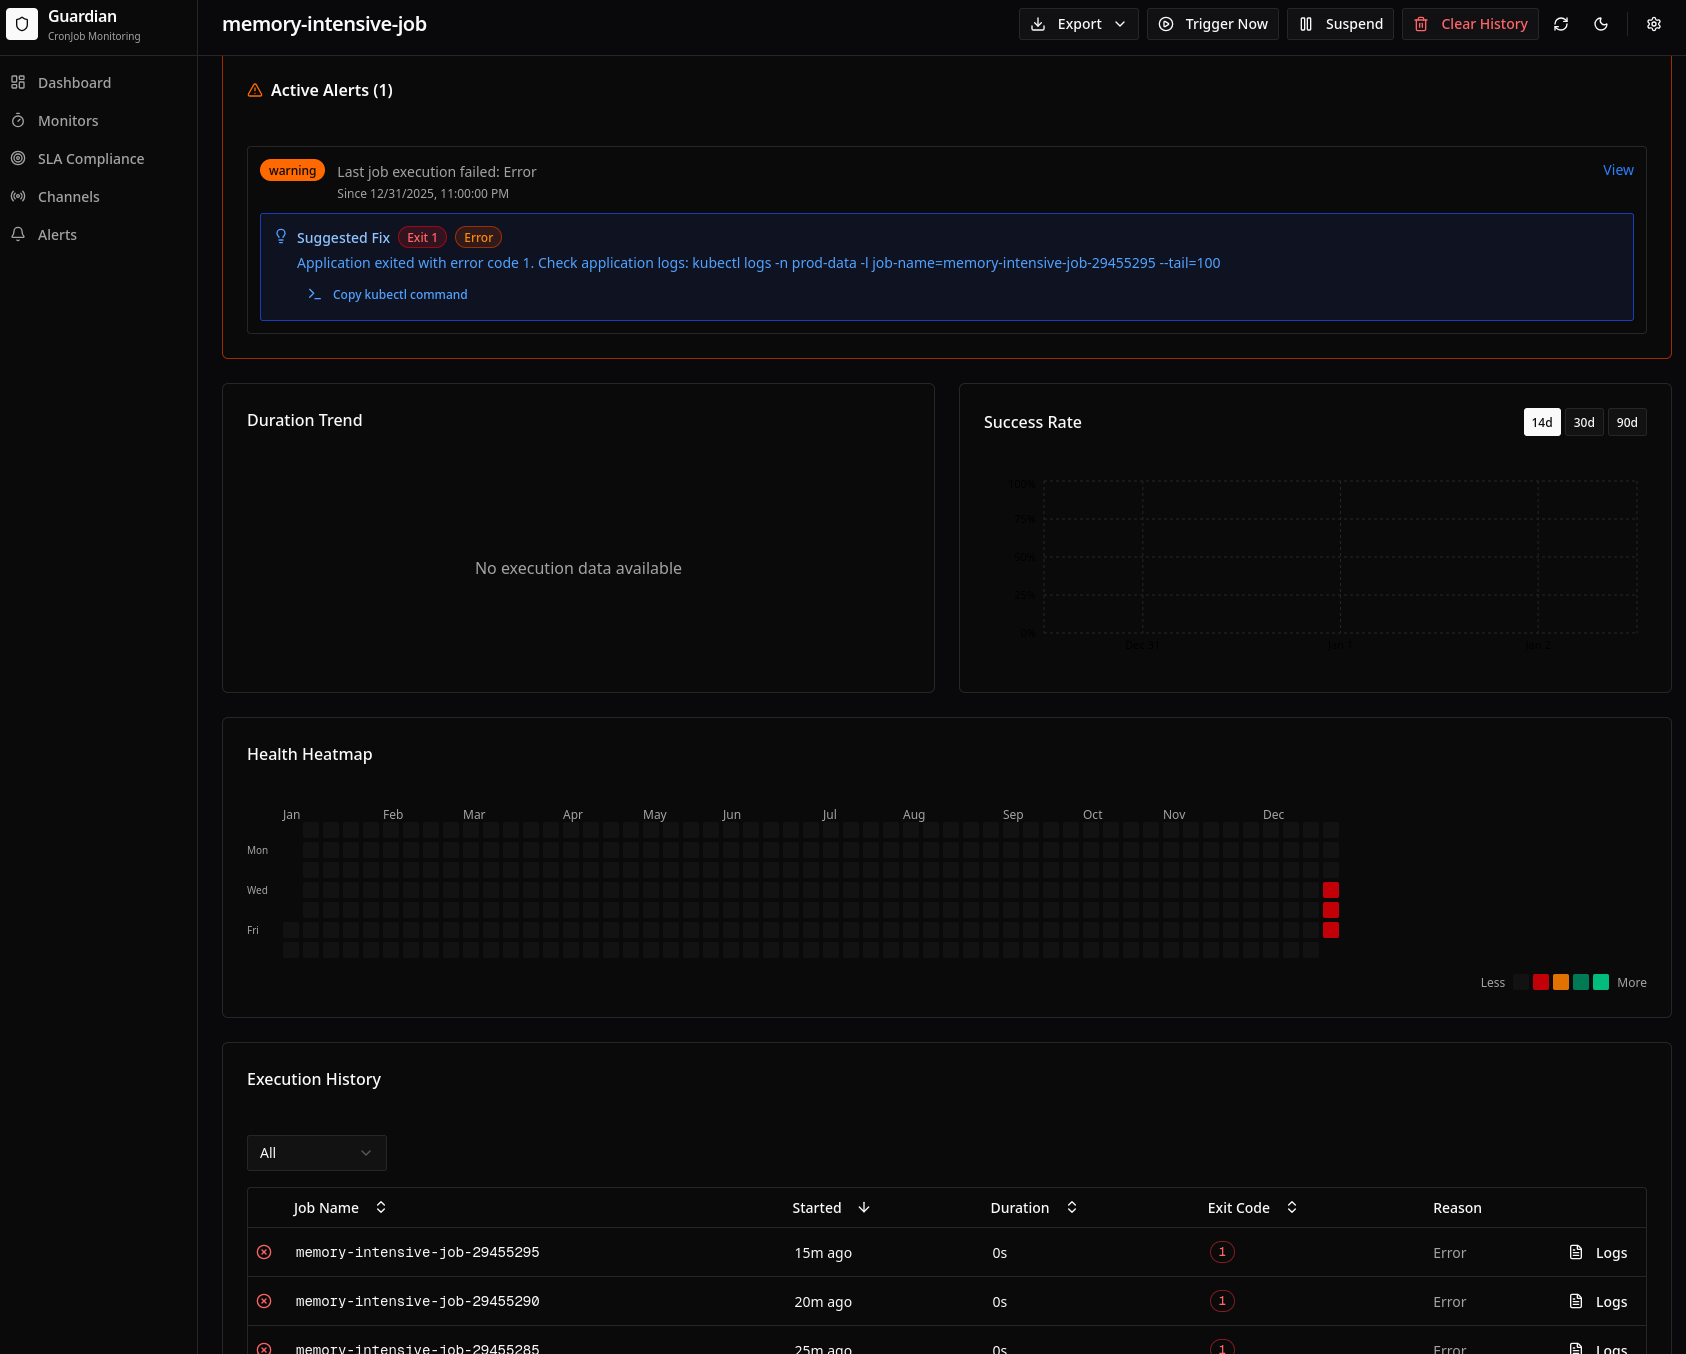
Features:
- P50/P95 lines: Median and 95th percentile trends
- Baseline reference: Horizontal line showing baseline P95
- Regression badge: Visible when regression is detected
- Time range selector: View 14, 30, or 90 days
Configuration Reference
| Field | Type | Description | Default |
|---|---|---|---|
maxDuration | duration | Absolute maximum allowed duration | - |
durationRegressionThreshold | int | Percentage increase to trigger alert | - |
durationBaselineWindowDays | int | Days for baseline calculation | 7 |
Alert Content
Regression alerts include:
📈 Duration Regression Detected: daily-sync

P95 Duration increased by 67%
  Baseline (14d avg): 12m 30s
  Current: 20m 54s

This trend may indicate:
• Growing data volume
• Database performance issues
• Resource contention

View execution history: [Dashboard Link]
Best Practices
-
Set baseline appropriately:
- Daily jobs: 7-14 days
- Weekly jobs: 28-60 days
- Account for natural variation
-
Choose realistic thresholds:
- 25-30%: Catch early degradation
- 50%: Moderate sensitivity
- 100%+: Only major regressions
-
Combine with absolute limits:
- Regression catches trends
maxDurationcatches immediate issues
-
Consider job characteristics:
- Some jobs naturally vary more
- Batch jobs may have valid variation
Investigating Regressions
When a regression alert fires:
- Check the dashboard: View the duration trend chart
- Compare time periods: Look at what changed around the inflection point
- Review job logs: Check for new warnings or patterns
- Check resource usage: Look at CPU/memory metrics
- Examine data growth: Verify input data size trends
- Review recent changes: Check deployments, config changes
Related
- SLA Tracking - Overall success rate monitoring
- Dashboard - Visualize duration trends
- Suggested Fixes - Automated troubleshooting hints