Quick Start
This guide walks you through setting up CronJob monitoring in 5 minutes.
Prerequisites
- CronJob Guardian installed in your cluster
- At least one CronJob running in your cluster
Step 1: Create an AlertChannel
First, create an alert channel to receive notifications. This example uses Slack:
slack-channel.yaml
apiVersion: guardian.illenium.net/v1alpha1
kind: AlertChannel
metadata:
  name: team-slack
spec:
  type: slack
  slack:
    webhookSecretRef:
      name: slack-webhook
      namespace: default
      key: url
Create the secret with your Slack webhook URL:
kubectl create secret generic slack-webhook \
  --from-literal=url=https://hooks.slack.com/services/YOUR/WEBHOOK/URL
Apply the channel:
kubectl apply -f slack-channel.yaml
Other Alert Channels
CronJob Guardian also supports PagerDuty, generic webhooks, and email. See Alerting Configuration for details.
Step 2: Create a CronJobMonitor
Now create a monitor to watch your CronJobs:
basic-monitor.yaml
apiVersion: guardian.illenium.net/v1alpha1
kind: CronJobMonitor
metadata:
  name: production-jobs
  namespace: production
spec:
  # Watch all CronJobs in this namespace
  selector: {}

  # Dead-man's switch: alert if jobs don't run
  deadManSwitch:
    enabled: true
    autoFromSchedule:
      enabled: true           # Detect expected interval from cron schedule
      missedScheduleThreshold: 2  # Alert after 2 missed runs

  # SLA tracking
  sla:
    minSuccessRate: 95      # Alert if success rate drops below 95%
    windowDays: 7           # Over a 7-day rolling window

  # Where to send alerts
  alerting:
    channelRefs:
      - name: team-slack
Apply the monitor:
kubectl apply -f basic-monitor.yaml
Step 3: Access the Dashboard
Port-forward to access the web UI:
kubectl port-forward -n cronjob-guardian svc/cronjob-guardian 8080:8080
Open http://localhost:8080 in your browser.
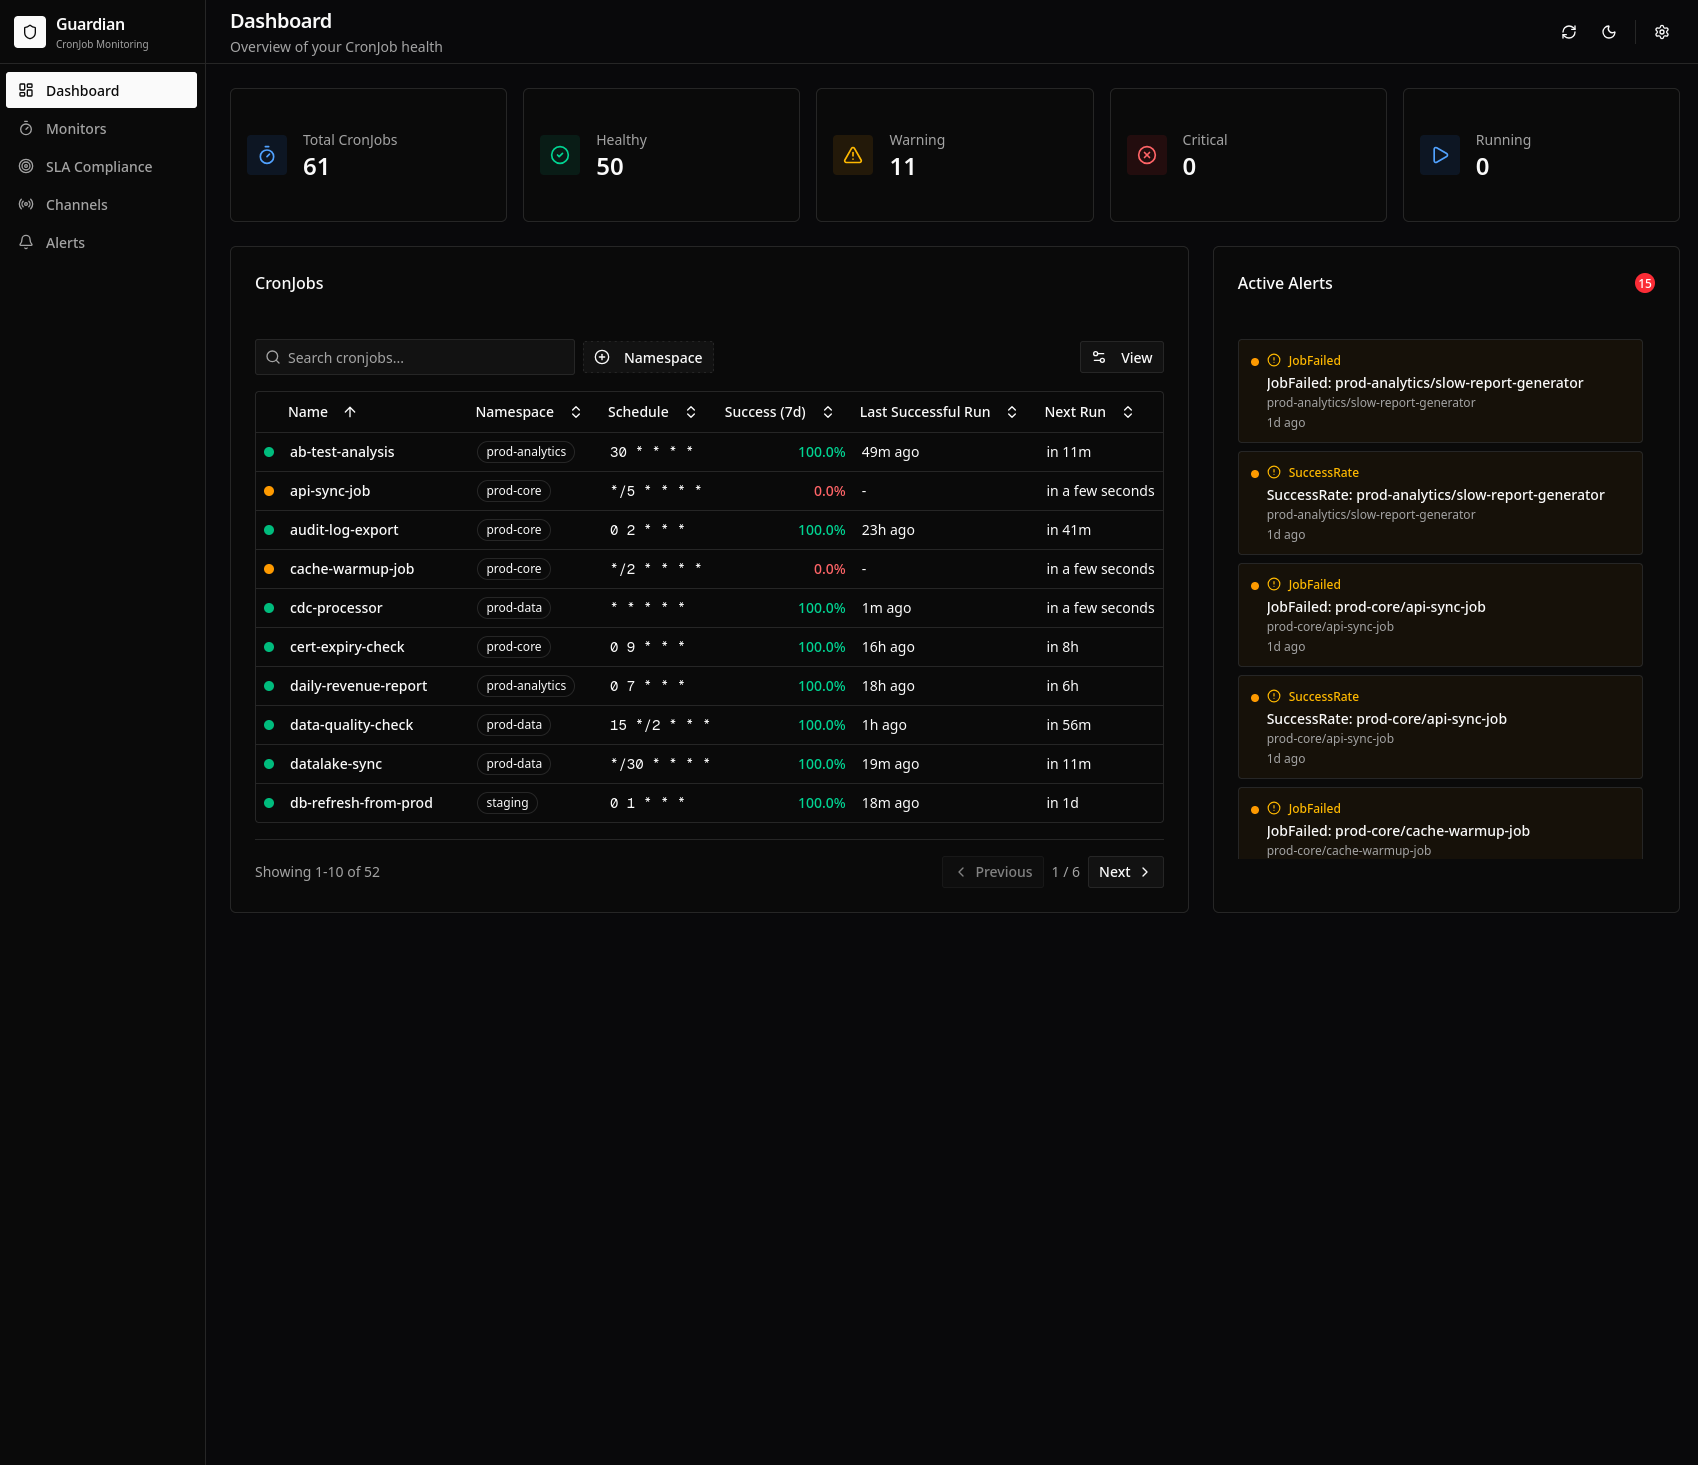
The dashboard shows:
- Overview: Summary cards, CronJob health table, active alerts
- CronJob Details: Per-job metrics, execution history, charts
- SLA: Compliance dashboard with breach tracking
- Alerts: Alert history with filtering
Step 4: Test the Setup
Verify monitoring is working by checking the CronJobMonitor status:
kubectl get cronjobmonitor production-jobs -n production -o yaml
Look for the status section showing discovered CronJobs and their health.
To test alerting, you can:
- Manually fail a job: Create a CronJob that exits with error
- Use the test button: In the dashboard, go to Channels and click "Test"
- Wait for natural failures: Monitor will catch real issues automatically
Example: Watch Critical Jobs Only
Use label selectors to watch specific CronJobs:
critical-only.yaml
apiVersion: guardian.illenium.net/v1alpha1
kind: CronJobMonitor
metadata:
  name: critical-jobs
  namespace: production
spec:
  selector:
    matchLabels:
      tier: critical

  deadManSwitch:
    enabled: true
    autoFromSchedule:
      enabled: true

  sla:
    minSuccessRate: 99.9    # Stricter SLA for critical jobs
    windowDays: 30
    maxDuration: 1h         # Alert if jobs take longer than 1 hour

  alerting:
    channelRefs:
      - name: team-slack
    severityOverrides:
      deadManTriggered: critical    # Dead-man failures are critical
      slaBreached: warning          # SLA violations are warnings
Example: Multi-Namespace Watch
Watch CronJobs across multiple namespaces:
multi-namespace.yaml
apiVersion: guardian.illenium.net/v1alpha1
kind: CronJobMonitor
metadata:
  name: all-production
  namespace: cronjob-guardian
spec:
  # Watch these namespaces
  namespaces:
    - production
    - staging
    - batch-jobs

  selector:
    matchLabels:
      monitored: "true"

  deadManSwitch:
    enabled: true
    autoFromSchedule:
      enabled: true

  alerting:
    channelRefs:
      - name: team-slack
Next Steps
- Features - Learn about all monitoring features
- CronJob Selectors - Advanced selection patterns
- Alert Configuration - Customize alert behavior
- Examples - More monitor configurations